Web Platform
9.1) Spectral Trend Graphs
Updated at 3/7/2023
The user can follow the trend of the data from his spectral collections, i.e., graphs with the energy in each spectral collection performed. The tool is available via the “![]() ” button in the upper right corner of the Spot Viewer screen.
” button in the upper right corner of the Spot Viewer screen.
By clicking this button, the user will be taken to the “Spectral Trend” screen and will find by default the global RMS level trends for acceleration, velocity, and displacement. With this tool, it will be possible to view the spectral measurements history in a very visual way, thus highlighting possible evolutions in the vibration levels of the machinery.
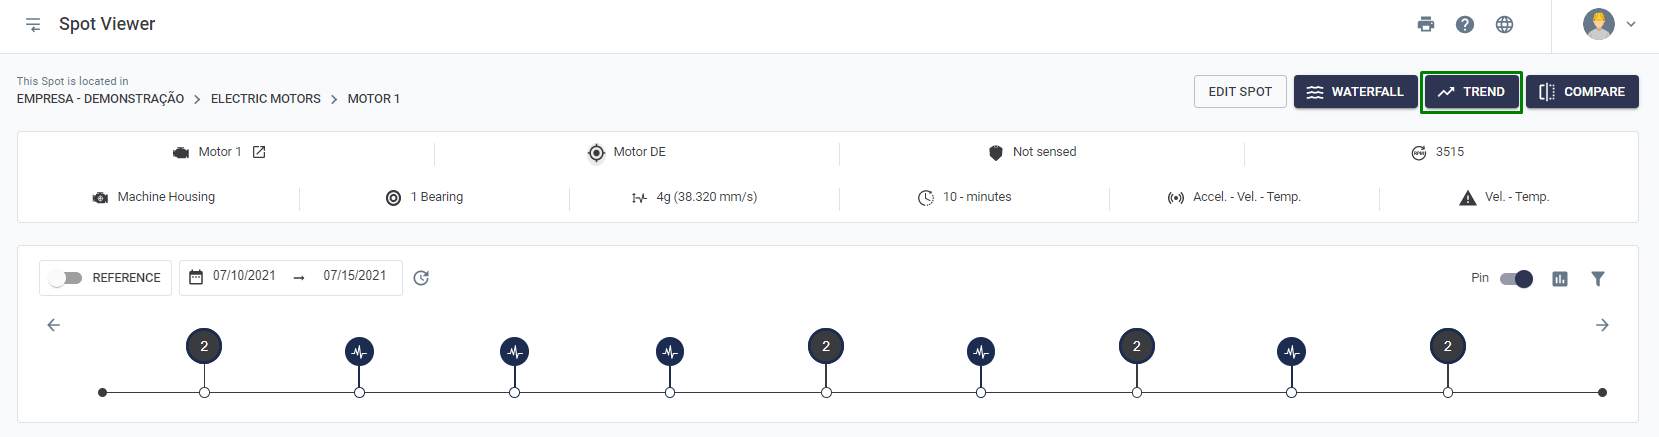
Figure: Accessing the spectral trend screen via spot viewer
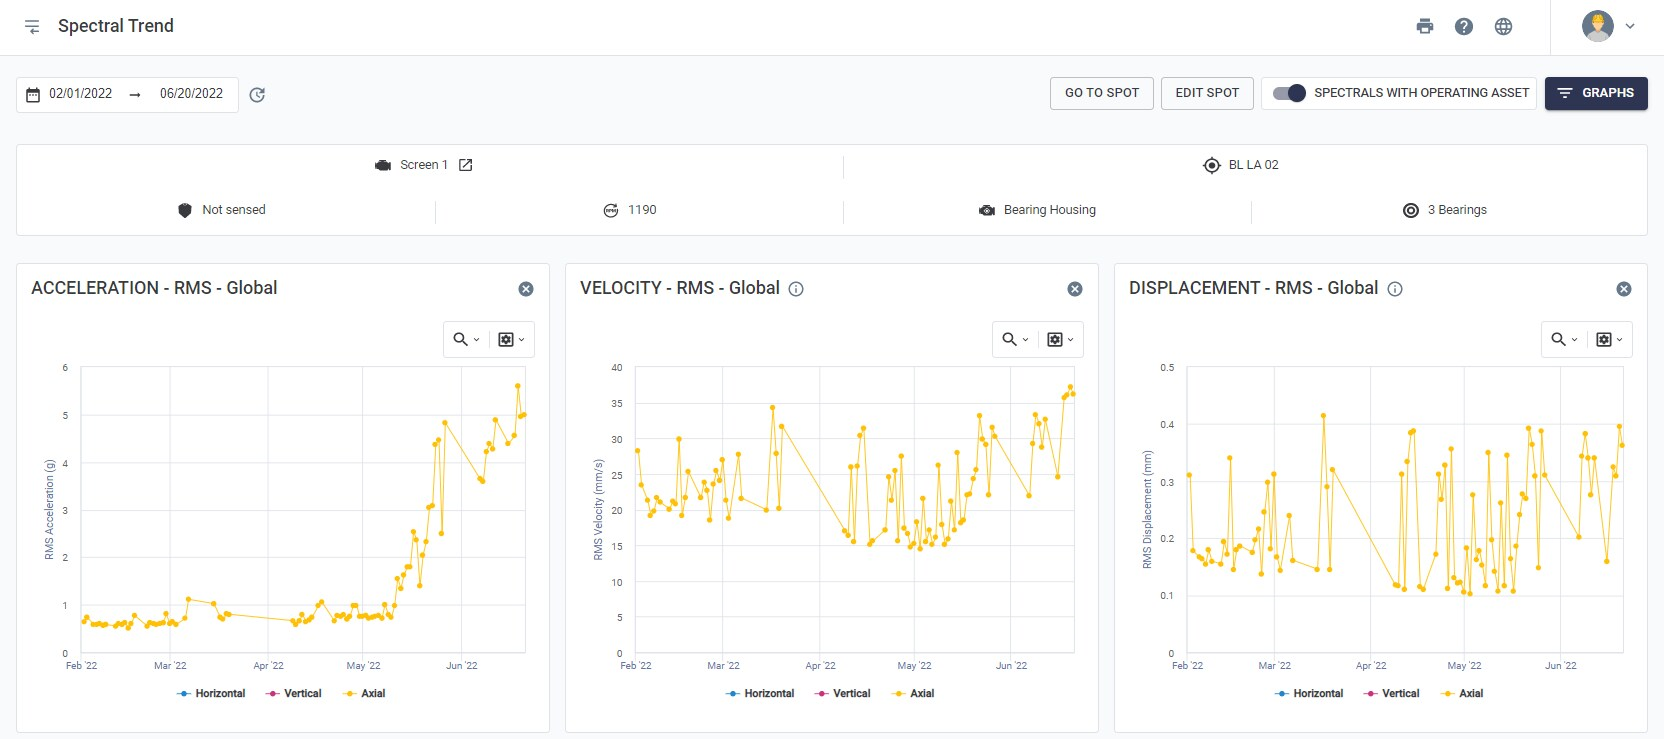
Figure: Standard spectral trend with plots of acceleration, velocity and displacement
Clicking on one of the graph points takes you to the spectral analysis screen for the time at which the spectrum was recorded. The arrangement of the graph data takes into account the time period selected in the header at the top of the screen.
This tool also allows the user to select metrics by frequency bands, highlighting evolutions in the vibration pattern of different machine components. For this, the Platform makes available more than 80 types of graphics, through the “
The available graphs provide global metrics by frequency range and several others. In addition, you can add multiple graphs side by side to compare data trends. Some chart options are described in the picture:
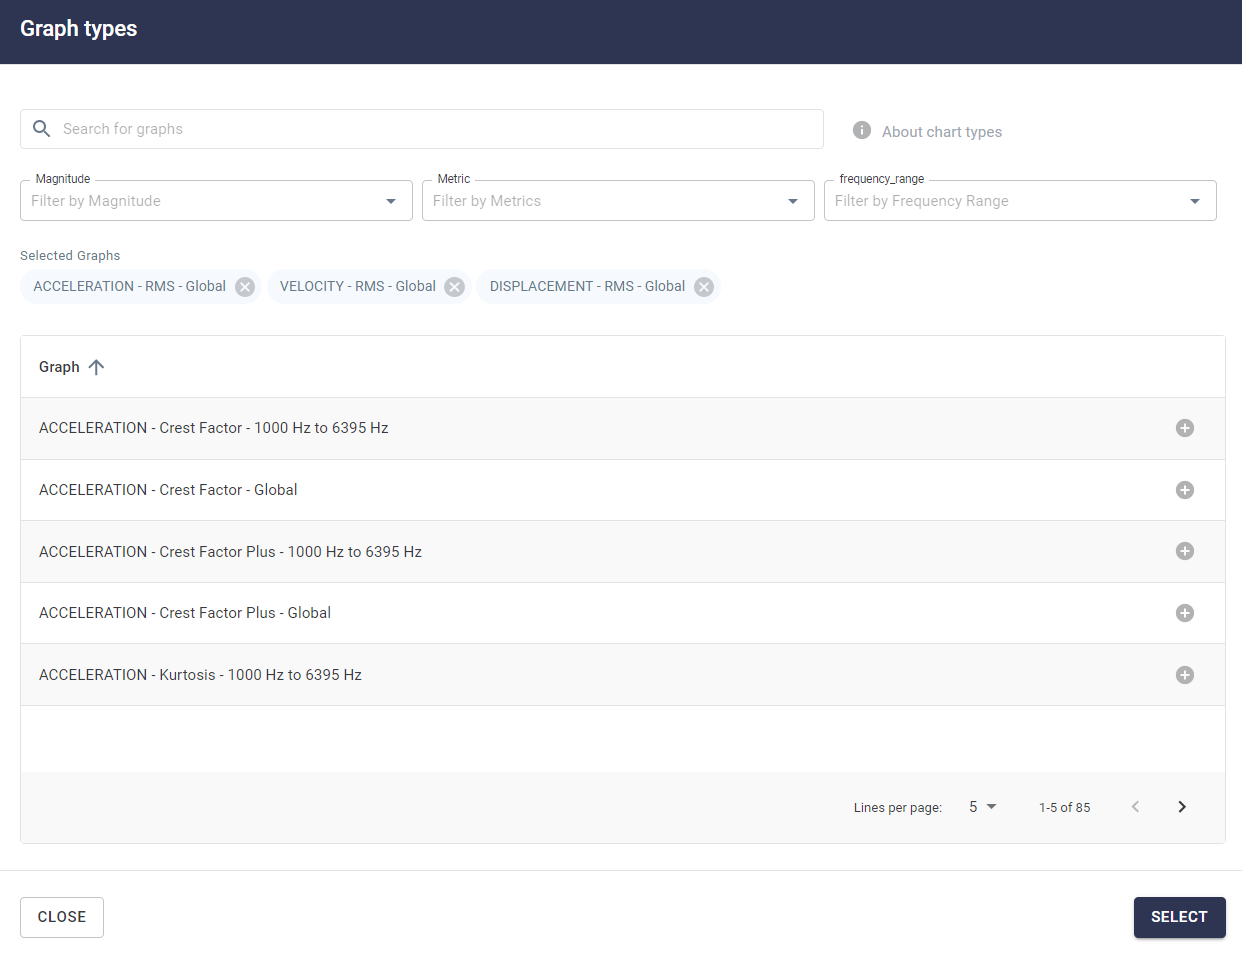
Figure: Selection of Spectral Trend Graph Types
After selecting the desired graphs and reloading the page, the new charts will be shown, as in an example below. In this case the RMS – Global displacement graph was removed and graphs per band were added, like the third one shown below, for “Velocity – RMS – 5 Hz to 50 Hz”.
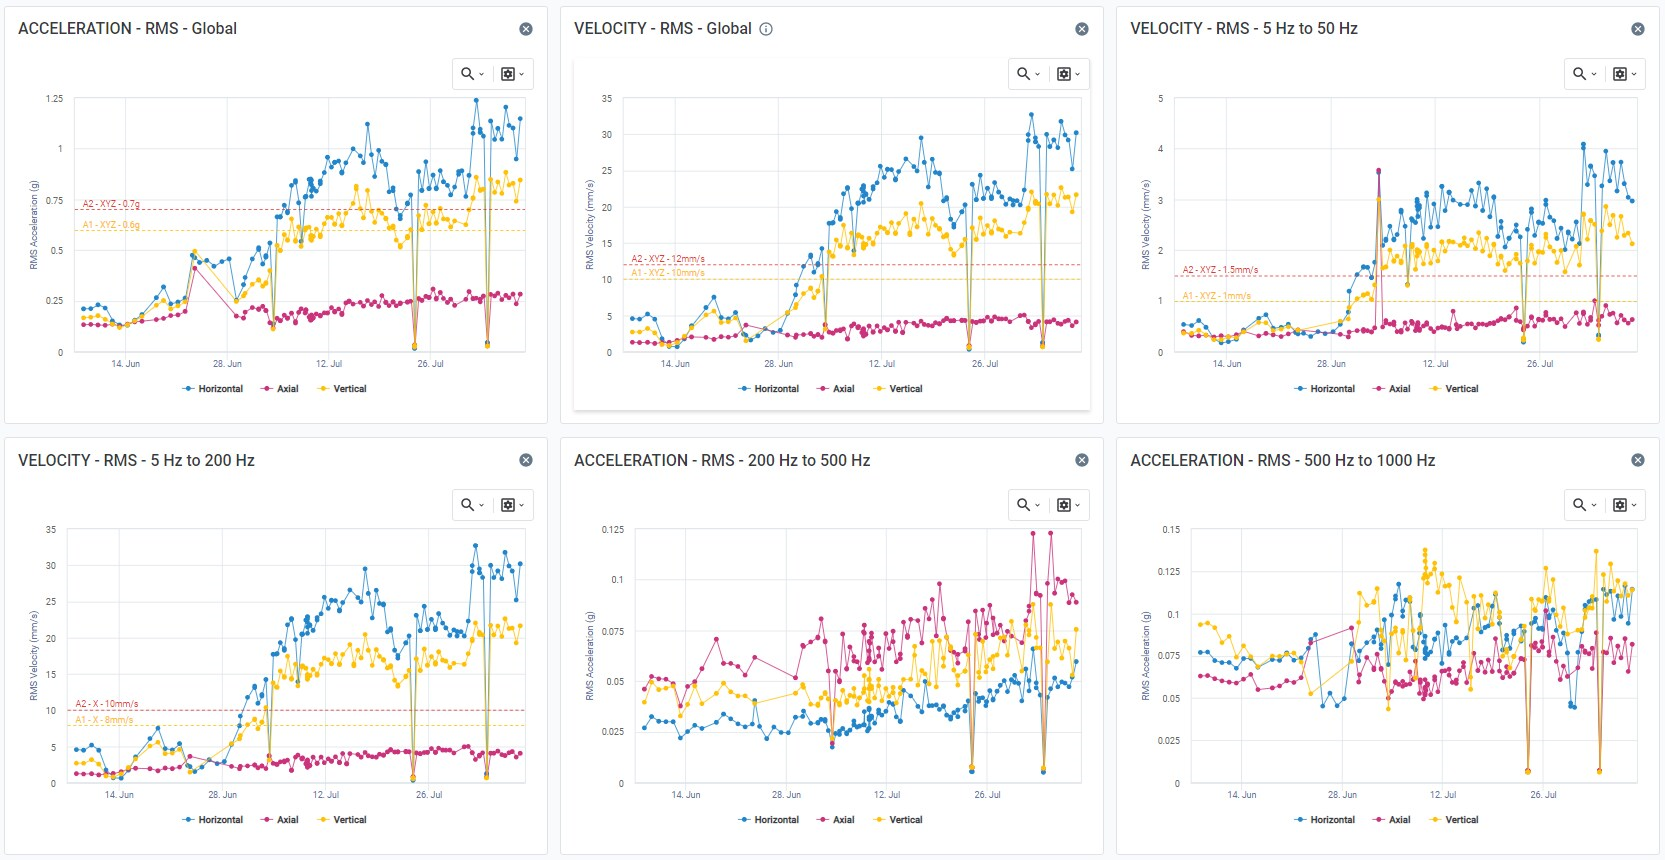
Figure: Spectral trend graphs in different bands and metrics
The “GRAPHICS” option momentarily saves the visualization of the chosen graphics. To save permanently for the Spot in question, the user must save the graphics via the viewing preferences tool.
Back to articles